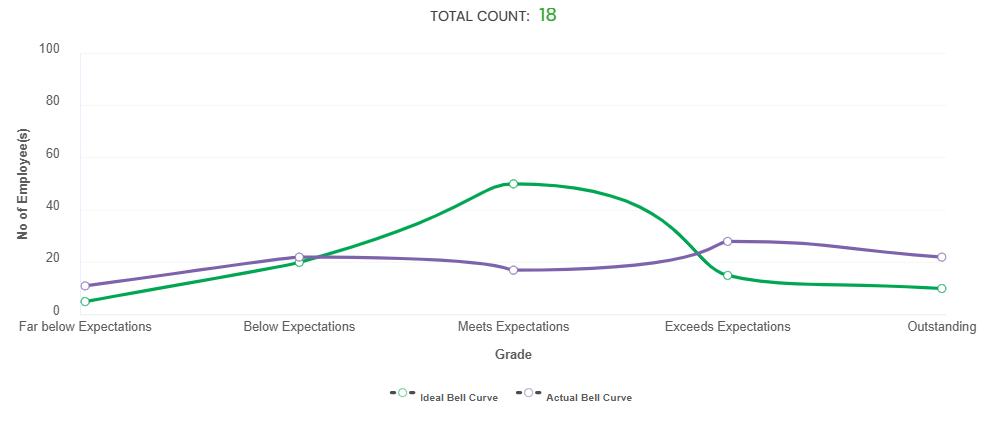
The ideal bell curve represents the expected or target distribution of employee performance ratings defined by HR. It outlines how performance scores should be spread across different rating categories to maintain fairness, consistency, and alignment with organizational performance standards.
Purpose:
- To maintain a balanced distribution of ratings across all employees.
- To avoid rating inflation or bias by ensuring that not everyone is rated at the top.
- To help plan rewards, promotions, and variable pay budgets fairly and consistently.
Typical Distribution Example:
10% – Top Performers (Outstanding)
70% – Meets Expectations (Average Performers)
20% – Below Expectations (Needs Improvement)
This pattern creates a “bell-shaped curve,” where most employees fall in the middle range, and fewer are rated at the extremes.
Ensures objectivity and consistency across teams.
Helps HR and management make data-driven decisions.
Encourages a realistic performance differentiation among employees.
The ideal bell curve serves as a benchmark for performance distribution within an organization. By comparing the actual ratings against this ideal pattern, organizations can ensure fair, transparent, and standardized performance evaluations.
In order to normalize the bell curve during the appraisal process, The same can be set at the beginning of the year.
- To set the ideal bell curve percentage, kindly reach us
- The desired ideal bell curve percentage can be set against each rating
- During the normalization process, HR can refer to the ideal bell curve and normalize the employee rating accordingly
The ideal bell curve acts as a guideline for distributing performance ratings fairly and consistently across the organization. By following this model, companies can maintain rating discipline, identify talent effectively, and promote fairness in the evaluation process. While not every team or department will perfectly fit the curve, it serves as a useful framework for ensuring balanced and meaningful performance assessments.
PS: Synergita implementation for your Organization may vary from how the features are described here. The screenshots given here may also be different from what you see in your system. Please talk to the concerned person in the Organization for any specific queries.